How Crunch OS connects the work
The whole operation.
In the same picture.
The weekly output
Your operation,
distilled into a weekly read.
Read sales, product margin and record checks in one weekly report. Then review suggested top-ups by supplier, with the stock and pack checks beside them.
Learn to read your weekly report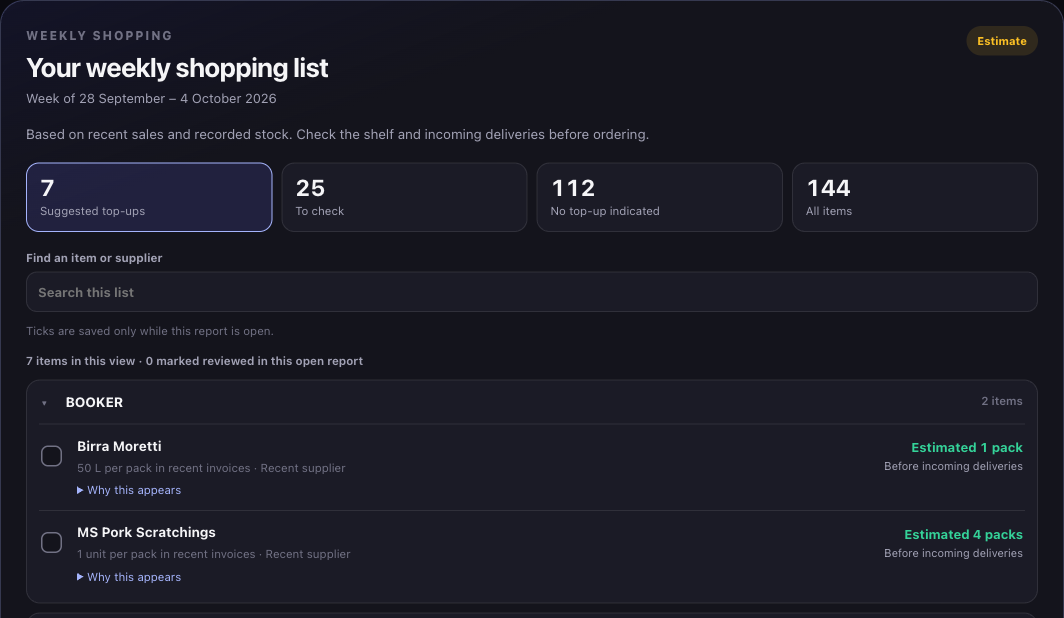
The conversation layer
Less searching.
More understanding.
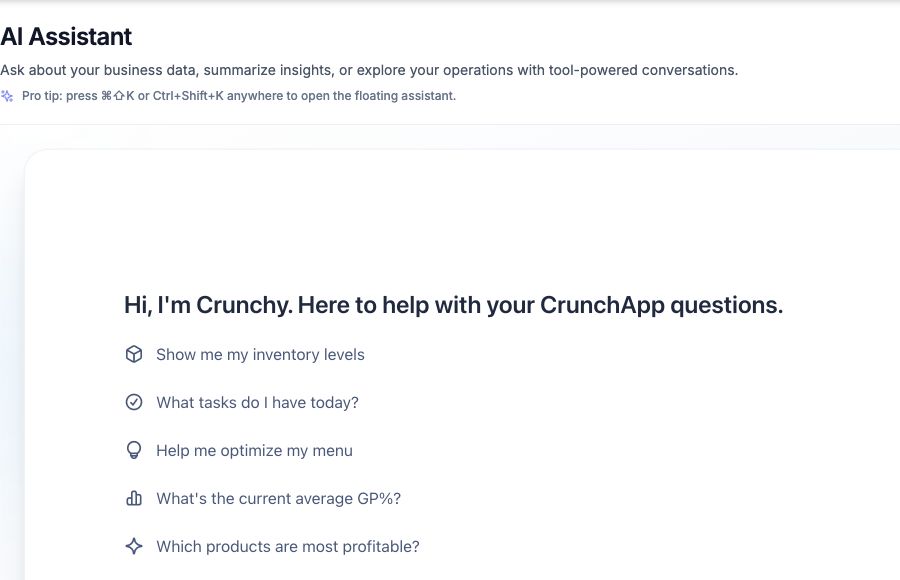
Alex helps you find your starting point. Crunchy brings the conversation into your workspace, where it can use your business context.
The closer look
Follow the pattern.
Find the driver.
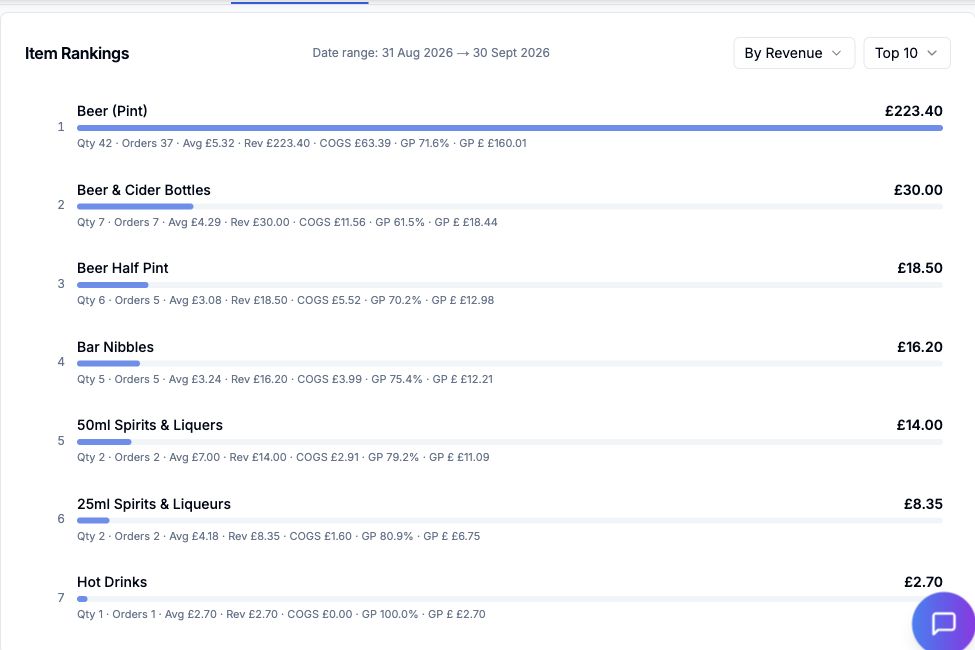
Explore sales, products and operational performance in the dashboard. Your weekly report gives you a starting point; analytics lets you look closer.
Explore your analyticsStock
Know what is on hand.
A shared catalogue connects the items you buy, the quantities you hold and the locations that use them. Keep stock details and supplier costs together.
Read the practical guideInteractive example · sample data
Recipes & menus
Price the dish. See the margin.
Connect recipes to ingredients, costs and menu items. When costs change, you have the context to review your selling prices and gross profit.
Read the practical guideA cost changes. You have the context to review the price.
Purchasing
Put the order in order.
Start with an invoice or build an order yourself. Review items and quantities alongside your stock, and keep the supplier and delivery in the same workflow.
Read the practical guide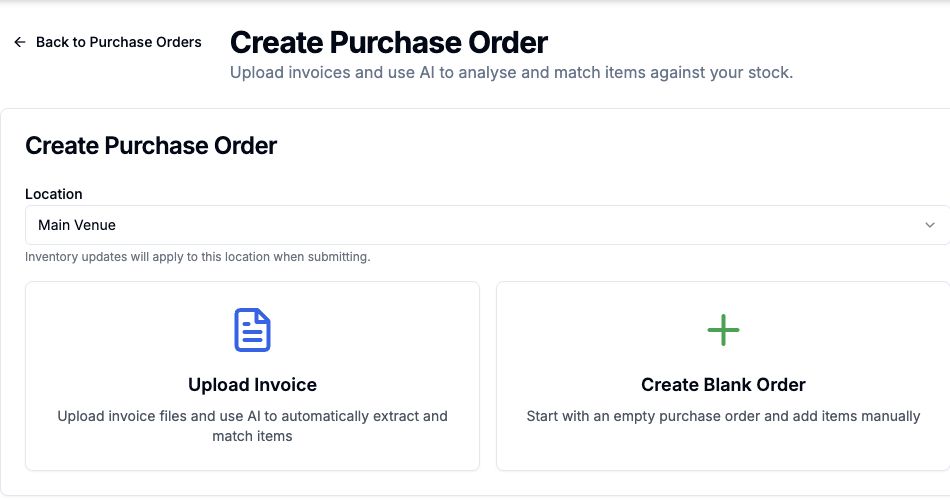
Stock takes
Make the count useful.
Count by storage area, bring the quantities into one venue total, then review differences. Keep the history so the next count starts with context.
Read the practical guide1/ 4items checked in this preview
Interactive example · sample data
Square & sales
Bring service into the picture.
Connect Square to Crunch to bring your POS catalogue and sales into the same operation as stock and menus. Review performance with the underlying costs in view.
Read the practical guide